If you have any questions or would like to get in touch, submit a call back request and our team will contact you as soon as possible or call us on 020 7499 6424 or email us at [email protected]
FY24 half year results
I am pleased to report that demand for our products and services remains strong across our Group with £1.2 billion of gross inflows during the period.
Andrew Shepherd, CEO

Documents
H1 FY24 report and accounts
H1 FY24 results presentation
H1 FY24 results presentation video
Financial highlights
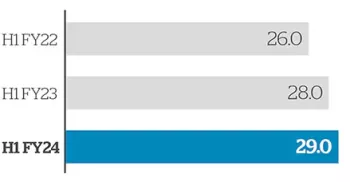
Funds under management (“FUM”) (£bn)
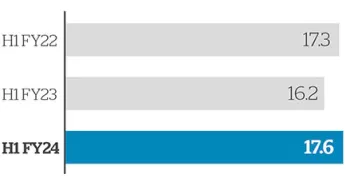
Underlying profit margin before tax1 (%)
1 The underlying figures represent the results for the Group’s continuing activities excluding underlying adjustments. These represent an alternative performance measure for the Group.
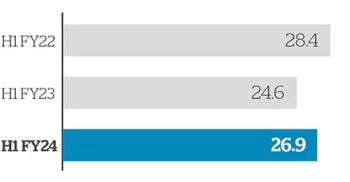
Revenue (£m)
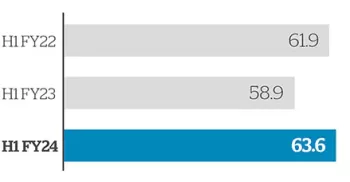
Underlying1 basic earnings per share (p)
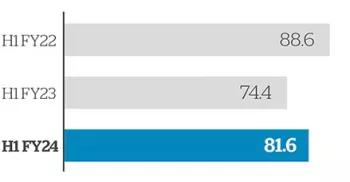
Underlying profit before tax1 (£m)
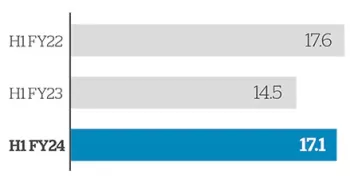
Interim dividend per share (p)
